AI and Machine Learning
With the full data pipeline already in place, a natural next step is to focus on extracting deeper insights from the data using Artificial Intelligence (AI) and Machine Learning (ML).
The current pipeline transforms raw movie data through Bronze, Silver, and Gold layers, ensuring clean and structured datasets. Building upon this, we can integrate AI/ML models to discover hidden patterns and generate predictions that go beyond traditional BI dashboards.
For instance, instead of only reporting on top-rated movies or box office trends, we could use ML to predict future popularity, recommend content, or classify movies by themes and audience engagement.
Architecture Vision
The underlying architecture remains mostly unchanged. However, a new ML workflow would be integrated after the Silver Layer, where structured and cleaned data is available. This data would feed ML models, and the predictions or insights generated would be added to the Gold Layer for final consumption.
This allows us to:
- Enrich the dataset with predicted values (e.g., popularity score)
- Generate features for advanced dashboards
- Automate analytics and content discovery
Initial Exploration
To validate this concept, I started a small proof-of-concept using the TMDB 5000 Movie Dataset from Kaggle.
The dataset contains metadata for 5000 movies, including fields such as budget, genres, release dates, cast, crew, and popularity score. Many of these columns overlap with our enriched Silver Layer, making it a suitable training base for model development.
First POC
The idea was to build a machine learning model capable of predicting the popularity of a movie, using metadata as input features.
To test this, I used a local Jupyter notebook and trained a basic regression model (RandomForestRegressor) to predict the popularity column.
Notebook & Code
You can access the notebook here:
Dataset Summary
- Size: ~5000 movies
- Features: title, release_date, genres, vote_average, vote_count, runtime, language, cast, crew, etc.
- Target:
popularity
Modeling Process
- Performed basic Exploratory Data Analysis (EDA)
- Applied Feature Engineering (genre encoding, date extraction, numeric transformations)
- Trained a Random Forest Regressor
Results
These early results are promising, especially considering that the data was not deeply explored—only lightly processed and used in a simple proof of concept to validate the idea.
- RMSE:
17.99 - R² (Train):
0.934 - R² (Test):
0.681
Visualizations
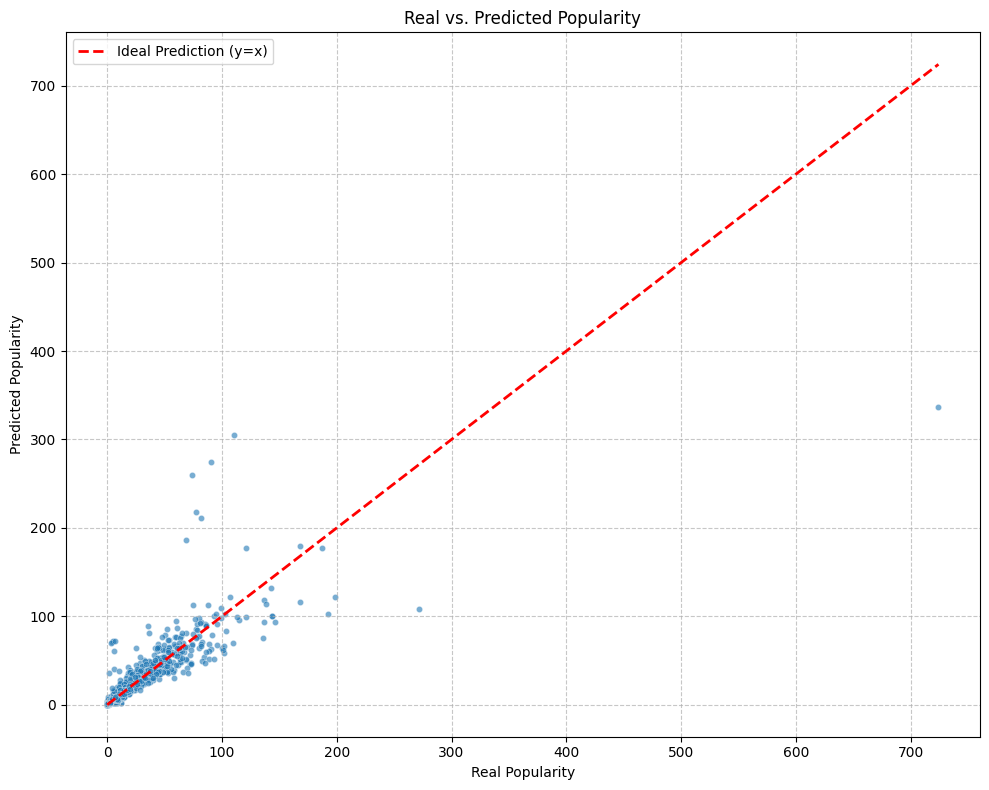
- Real vs. Predicted Popularity
This scatter plot displays most points aligned near the ideal line, indicating the model captures the general trend. However, dispersion increases for higher popularity values, suggesting difficulty in predicting extreme values.
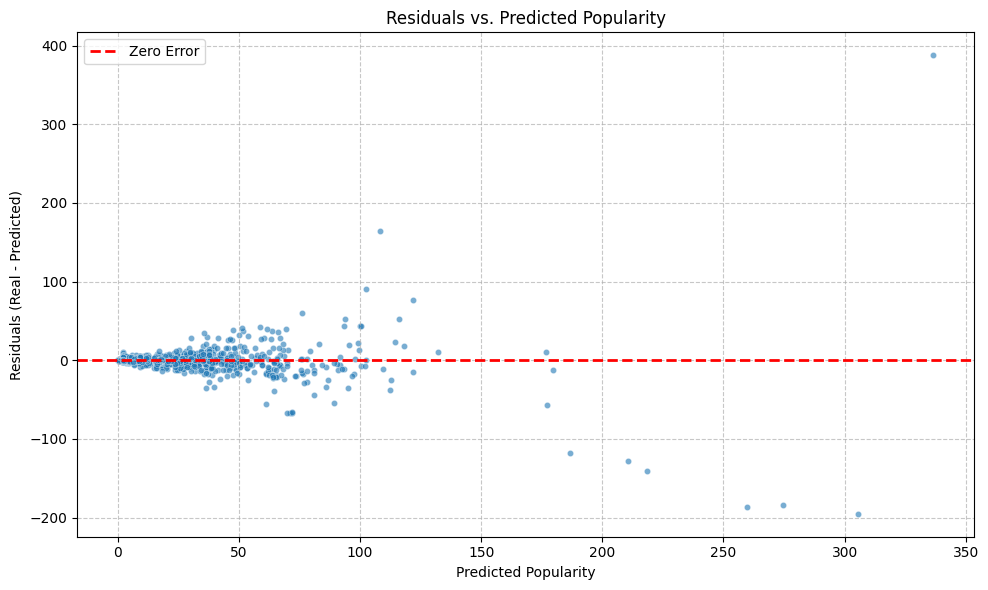
- Residuals vs. Predicted Popularity
This plot shows the errors (residuals) against the predicted popularity. The residuals are mostly centered around zero for lower predicted values, but a noticeable spread emerges for higher predictions, with some significant positive and negative errors.
This pattern suggests that the model's prediction accuracy decreases as movie popularity increases.
- Top 5 Best Predictions
| Title | Real Popularity | Predicted Popularity | Absolute Error |
|---|---|---|---|
| Three Kingdoms: Resurrection of the Dragon | 4.127155 | 4.121139 | 0.006016 |
| The Last Legion | 12.282911 | 12.274450 | 0.008461 |
| Ong Bak 2 | 9.029489 | 9.015688 | 0.013801 |
| Jason Goes to Hell: The Final Friday | 10.341982 | 10.327849 | 0.014133 |
| Sands of Iwo Jima | 3.851000 | 3.835227 | 0.015773 |
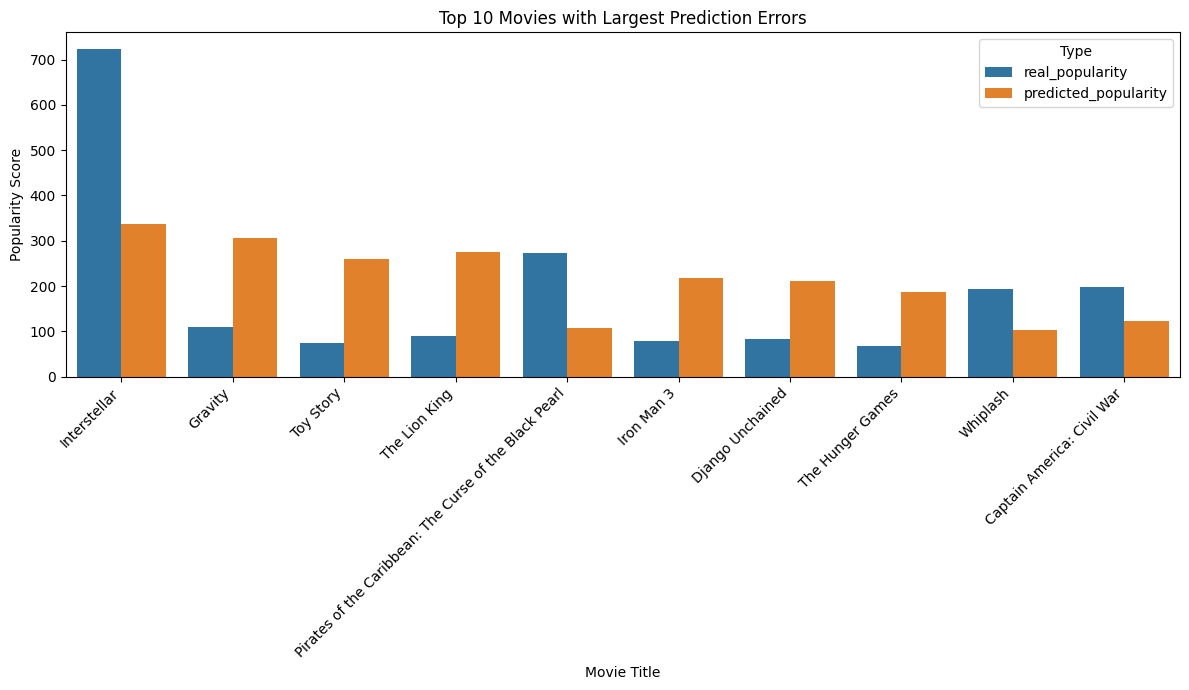
- Top 10 Worst Predictions
| Title | Real Popularity | Predicted Popularity | Absolute Error |
|---|---|---|---|
| Interstellar | 724.247784 | 336.452864 | 387.794920 |
| Gravity | 110.153618 | 305.401820 | 195.248202 |
| Toy Story | 73.640445 | 259.727407 | 186.086962 |
| The Lion King | 90.457886 | 274.710194 | 184.252308 |
| Pirates of the Caribbean: The Curse of the Black Pearl | 271.972889 | 108.266098 | 163.706791 |
| Iron Man 3 | 77.682080 | 218.344458 | 140.662378 |
| Django Unchained | 82.121691 | 210.649875 | 128.528184 |
| The Hunger Games | 68.550698 | 186.539071 | 117.988373 |
| Whiplash | 192.528841 | 102.475957 | 90.052884 |
| Captain America: Civil War | 198.372395 | 121.713008 | 76.659387 |
This chart highlights significant prediction errors, with the model notably underestimating highly popular films like "Interstellar". Conversely, it overestimated others such as "Gravity", indicating challenges in consistent accuracy across the popularity spectrum.
These specific cases, especially those with very large absolute errors, may represent outliers that require further investigation.
Conclusion
This proof-of-concept was developed entirely in a local environment using Jupyter notebooks, and its main purpose was to validate the feasibility of applying machine learning to our enriched movie dataset. It’s important to note that this exploration was conducted outside the core project scope, solely as an experimental step to test potential directions.
That said, the results clearly demonstrate that predicting movie popularity based on metadata is achievable and can offer significant value when integrated into a production-ready pipeline.
If explored further, this concept could be fully integrated into the existing serverless architecture using native AWS services. For example:
- A machine learning model could be trained and deployed using Amazon SageMaker
- A new Lambda function in the pipeline could invoke the SageMaker endpoint
- Predicted values could be stored alongside other transformed data in the Gold Layer
This would enable automated predictions at scale, unlocking even deeper insights and analytics possibilities from the movie data.