Amazon QuickSight
Amazon QuickSight was chosen as the dashboarding tool for this project, enabling dynamic data visualization directly from the Gold Layer in S3. Its native integration with AWS services, especially S3, made it a seamless choice.
However, this component could easily be replaced by any other BI tool capable of consuming data from S3, such as:
- Power BI
- Google Data Studio
- SAP Analytics Cloud
- Tableau
The main goal was to demonstrate how insights could be extracted once the ETL pipeline had completed and the data was ready for analysis.
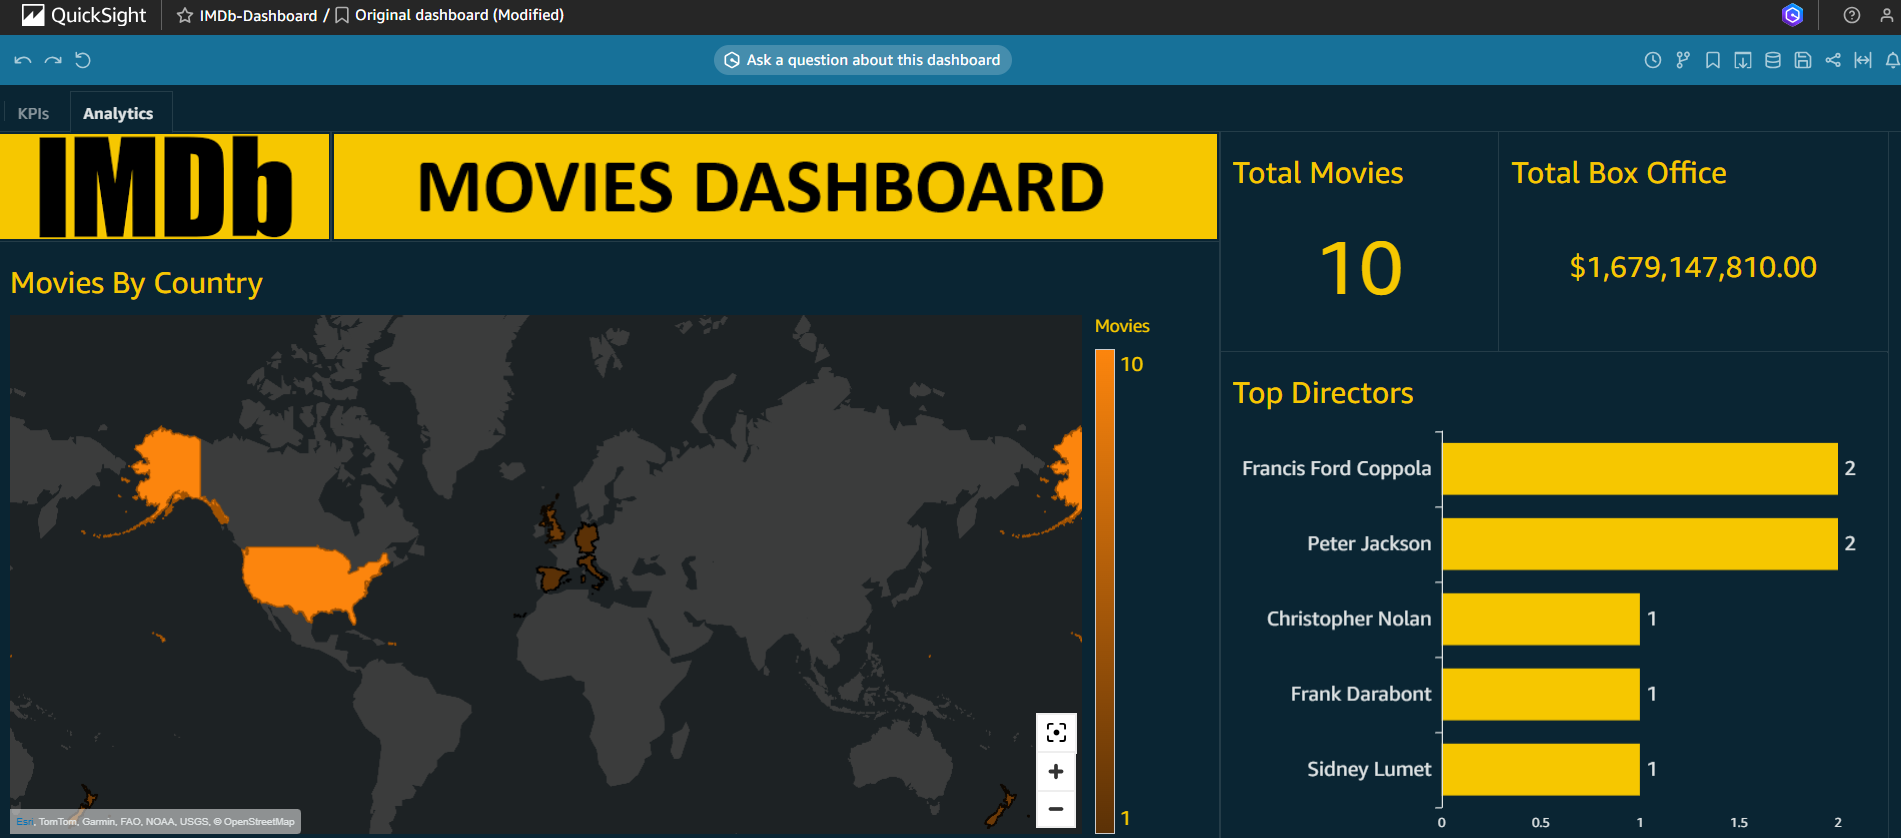
Dashboard Overview
All visuals are connected to datasets loaded directly from the Gold S3 bucket, ensuring the most up-to-date view of the enriched and transformed data.
Screenshots
The dashboard created in QuickSight includes two primary pages:
KPIs Page
- Displays key performance indicators such as top IMDb ratings, awards and total box office.
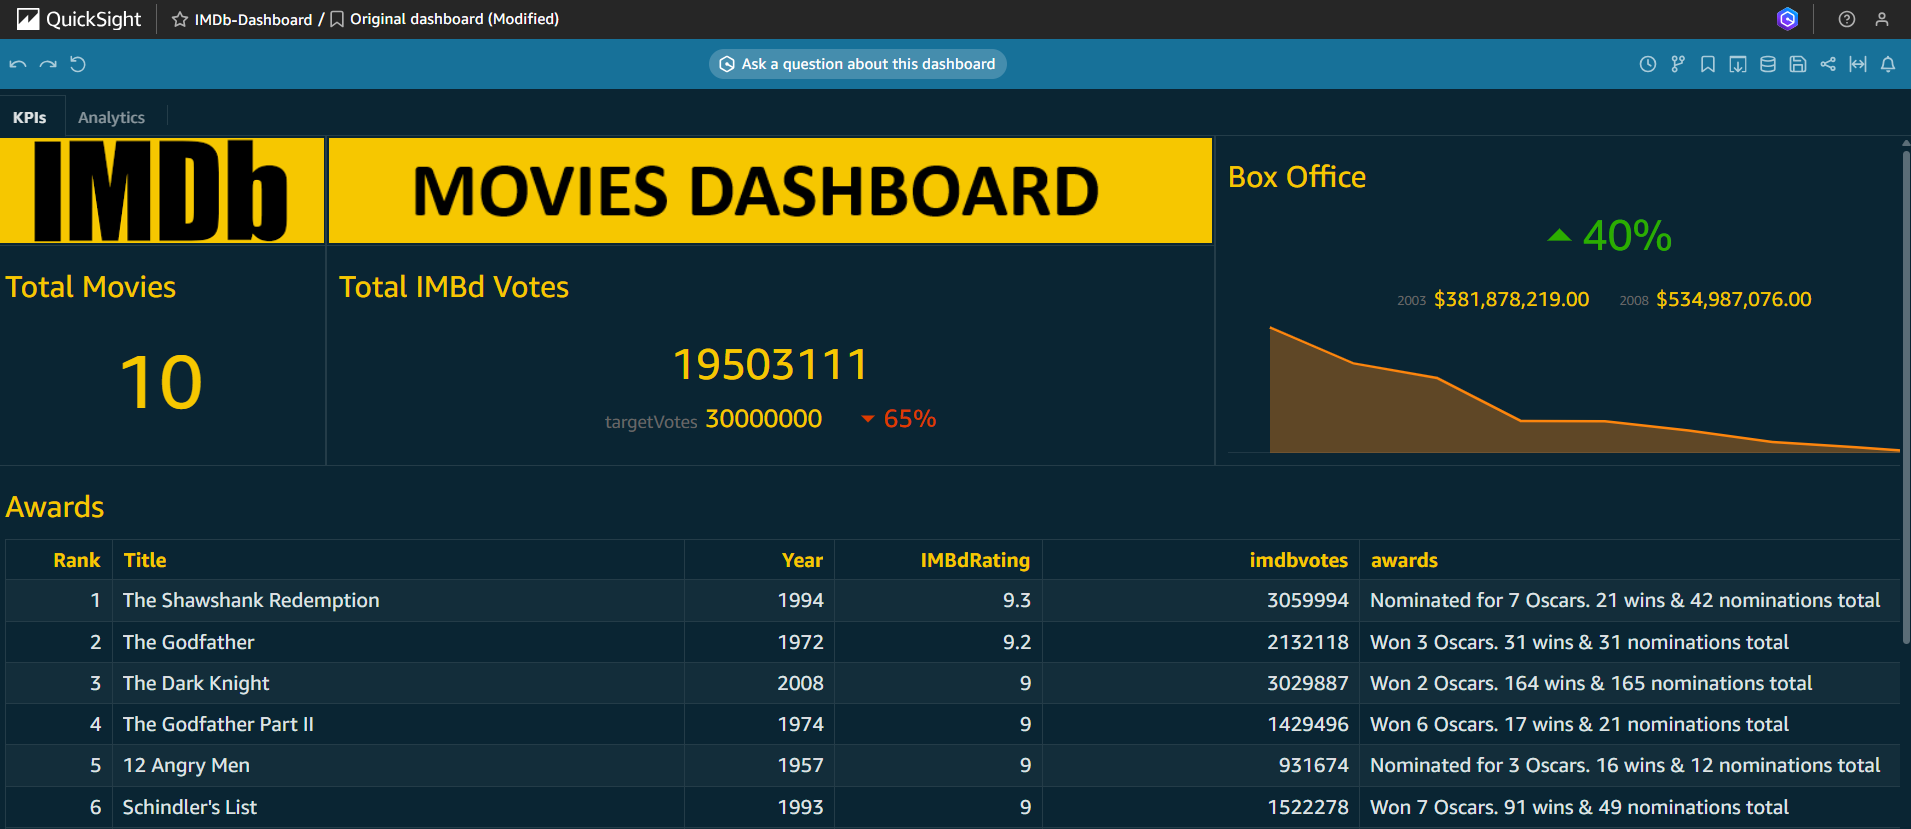
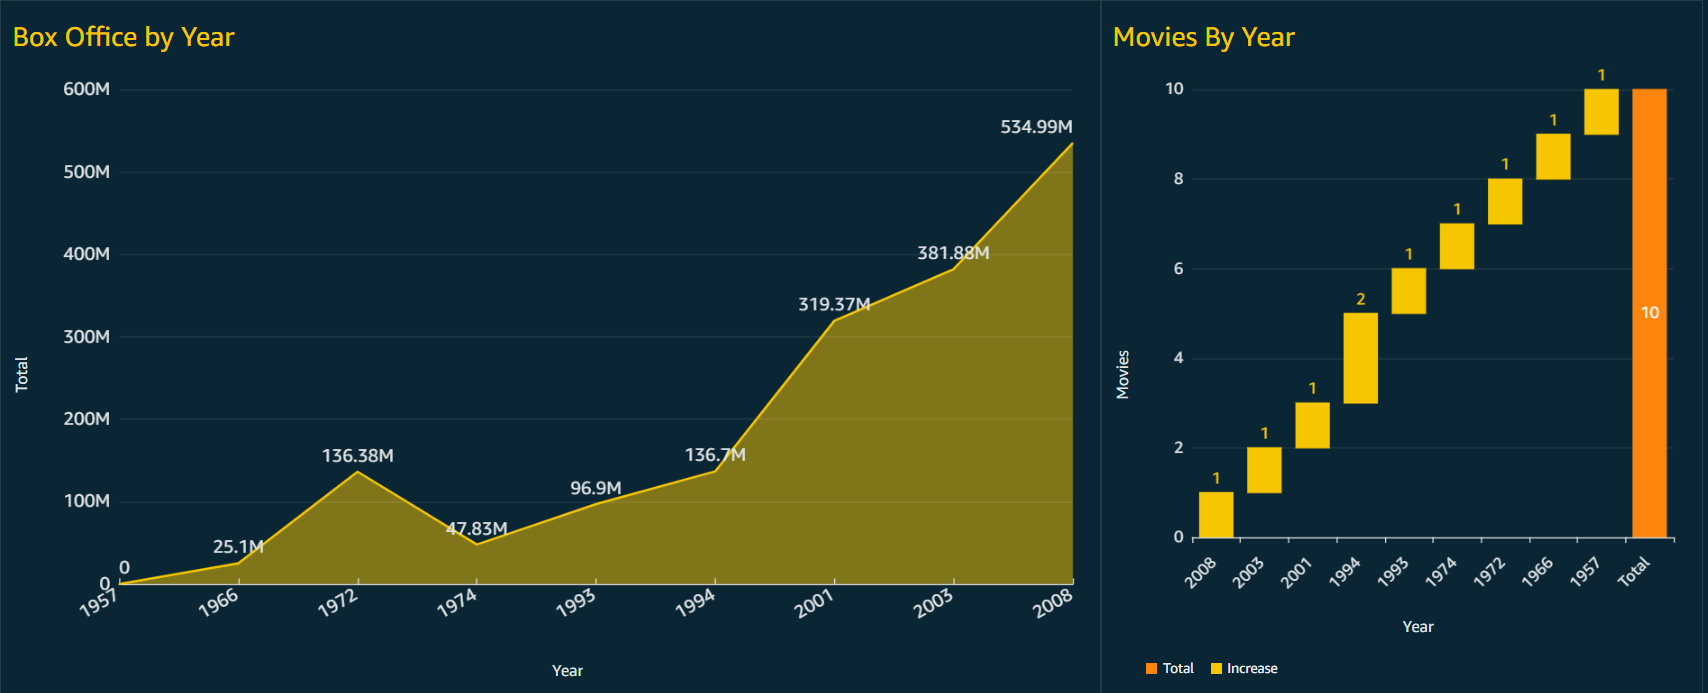
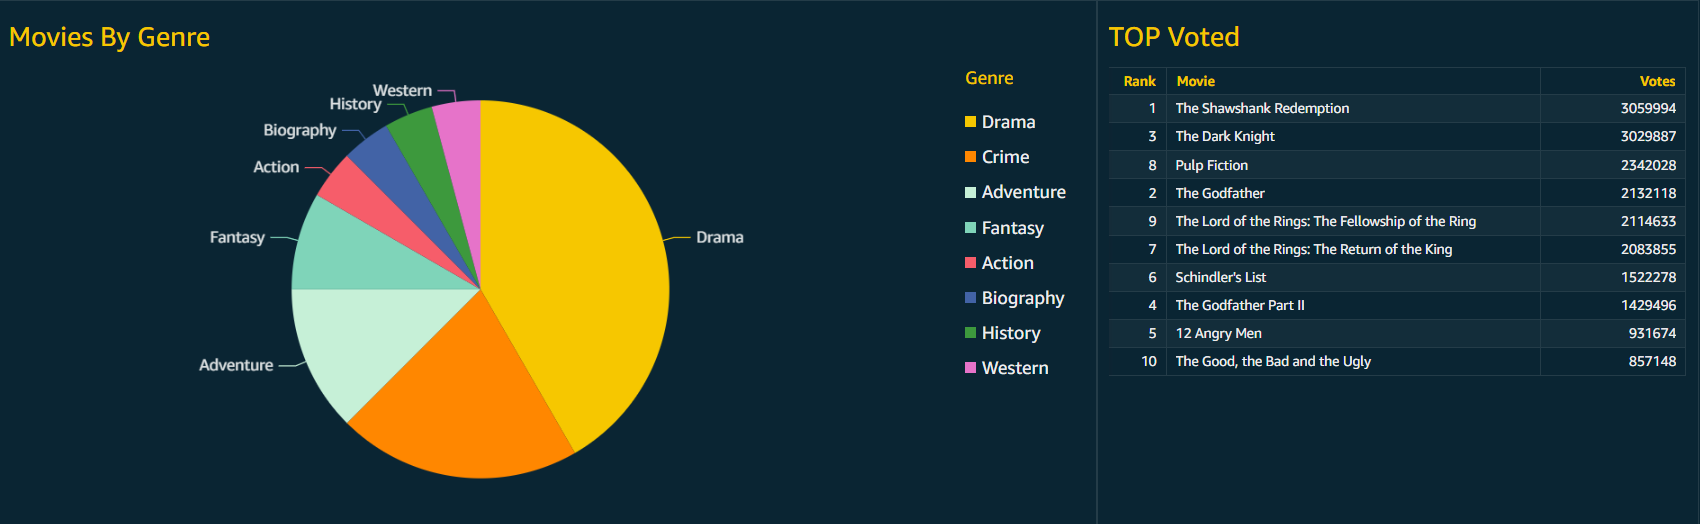
Analytics Page
- Offers deeper interactive analysis based on filters like year, director, genre and country.